.gtr-container-ledsim789 {
font-family: Verdana, Helvetica, “Times New Roman”, Arial, sans-serif;
color: #333;
line-height: 1.6;
padding: 15px;
box-sizing: border-box;
}
.gtr-container-ledsim789__title {
font-size: 18px;
font-weight: bold;
margin-bottom: 15px;
color: #0056b3;
text-align: left;
}
.gtr-container-ledsim789__subtitle {
font-size: 14px;
font-style: italic;
margin-bottom: 20px;
color: #555;
text-align: left;
}
.gtr-container-ledsim789__section-title {
font-size: 18px;
font-weight: bold;
margin-top: 25px;
margin-bottom: 15px;
color: #0056b3;
text-align: left;
border-bottom: 1px solid #eee;
padding-bottom: 5px;
}
.gtr-container-ledsim789__subsection-title {
font-size: 16px;
font-weight: bold;
margin-top: 20px;
margin-bottom: 10px;
color: #007bff;
text-align: left;
}
.gtr-container-ledsim789 p {
font-size: 14px;
margin-bottom: 10px;
text-align: left !important;
word-break: normal;
overflow-wrap: normal;
}
.gtr-container-ledsim789 strong {
font-weight: bold;
color: #000;
}
.gtr-container-ledsim789 em {
font-style: italic;
color: #666;
}
.gtr-container-ledsim789__divider {
border-top: 1px solid #ddd;
margin: 25px 0;
}
.gtr-container-ledsim789__list,
.gtr-container-ledsim789__ordered-list {
list-style: none !important;
padding-left: 0 !important;
margin-left: 0 !important;
margin-bottom: 15px;
}
.gtr-container-ledsim789__list li,
.gtr-container-ledsim789__ordered-list li {
position: relative !important;
padding-left: 25px !important;
margin-bottom: 8px !important;
font-size: 14px;
text-align: left !important;
}
.gtr-container-ledsim789__list li::before {
content: "â¢" !important;
position: absolute !important;
left: 0 !important;
color: #007bff !important;
font-size: 1.2em !important;
line-height: 1.6 !important;
font-weight: bold !important;
}
.gtr-container-ledsim789__ordered-list {
counter-reset: list-item !important;
}
.gtr-container-ledsim789__ordered-list li::before {
content: counter(list-item) "." !important;
position: absolute !important;
left: 0 !important;
color: #007bff !important;
font-weight: bold !important;
text-align: right !important;
width: 20px !important;
line-height: 1.6 !important;
}
.gtr-container-ledsim789__table-wrapper {
overflow-x: auto;
margin-top: 20px;
margin-bottom: 20px;
}
.gtr-container-ledsim789__table {
width: 100%;
border-collapse: collapse !important;
border-spacing: 0 !important;
font-size: 14px;
min-width: 600px;
}
.gtr-container-ledsim789__table th,
.gtr-container-ledsim789__table td {
border: 1px solid #ccc !important;
padding: 10px !important;
text-align: left !important;
vertical-align: top !important;
word-break: normal !important;
overflow-wrap: normal !important;
}
.gtr-container-ledsim789__table th {
background-color: #f0f0f0;
font-weight: bold !important;
color: #333;
}
.gtr-container-ledsim789__table tbody tr:nth-child(even) {
background-color: #f9f9f9;
}
@media (min-width: 768px) {
.gtr-container-ledsim789 {
padding: 25px 50px;
}
.gtr-container-ledsim789__table {
min-width: auto;
}
.gtr-container-ledsim789__table-wrapper {
overflow-x: visible;
}
}
How Thermal Simulation Software Improves LED Heat Management
Why modern LED teams use virtual thermal modeling to avoid overheating failures, shorten development cycles, and build more reliable lighting products.
Introduction — Why Thermal Design Determines LED Reliability
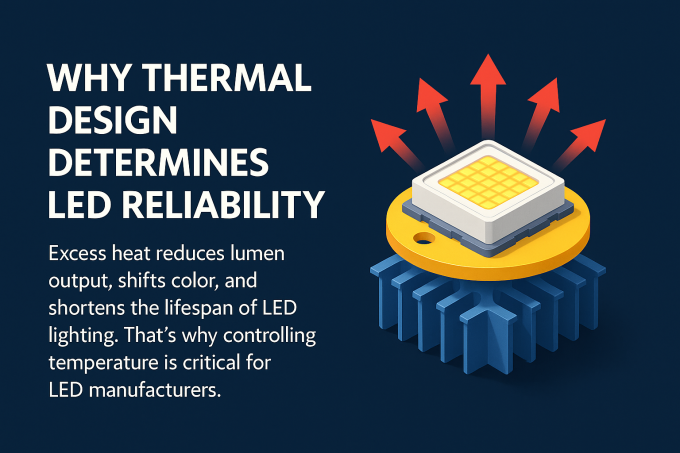
In LED manufacturing, every lumen depends on temperature.
Excess heat degrades lumen output, shifts chromaticity, accelerates phosphor aging, stresses drivers, and shortens overall lifetime. A junction that runs just 10°C hotter can cut L70 life roughly in half.
Because margins are tight and schedules are unforgiving, relying only on physical prototypes introduces costly redesign loops. Thermal simulation software changes the equation: engineers can predict heat flow, verify temperature limits, and optimize the heat path long before tooling or assembly begins.
Thermal design ensures the LED’s junction temperature stays within targets set by L70, chromaticity stability, and driver protection. Controlling heat early prevents warranty issues, color drift complaints, and field failures that damage brand reputation.
Why Thermal Simulation Matters for LED Manufacturers
Simulation replaces guesswork with data. It reveals hotspots, quantifies temperature margins, and compares design alternatives without building multiple prototypes. This accelerates program decisions, avoids over-engineering, and reduces quality risk.
Most LED thermal issues start at predictable choke points:
- Die attach area and package substrate
-
TIM layer and contact interfaces
-
MCPCB / IMS board design
-
Driver placement
-
Enclosure vents, airflow, and orientation
Simulation uncovers how each affects real-world performance.
What Thermal Simulation Can Answer
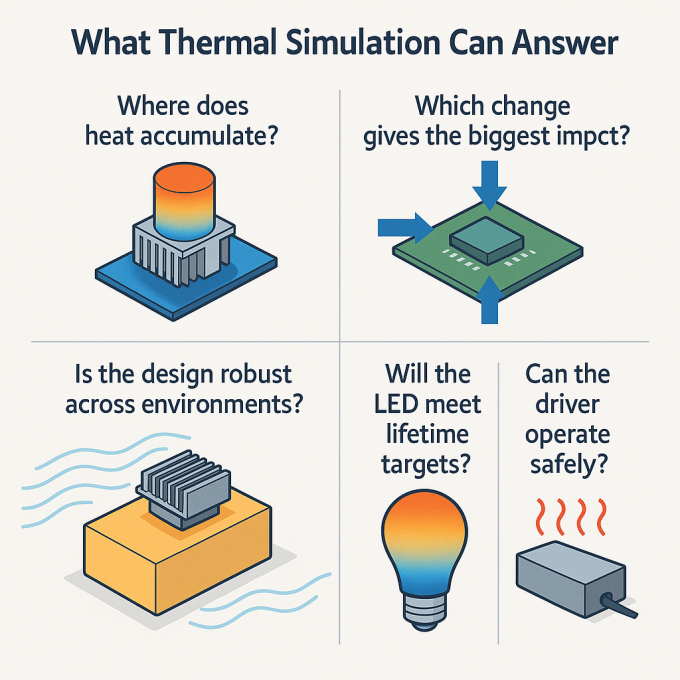
- Where does heat accumulate?
Identify the weakest links—TIM thickness, insufficient vias, stagnant air pockets, or undersized heat sinks.
Which change gives the biggest impact?
Quickly test if adding vias, increasing copper, or modifying fin spacing improves thermal resistance.
- Is the design robust across environments?
Validate performance at 25°C, 40°C, and 55°C; evaluate vertical vs. horizontal mounting; simulate dust buildup.
Will the LED meet lifetime targets?
Check junction temperature margins for L70 and chromaticity stability.
- Can the driver operate safely?
Evaluate case temperature under load to avoid derating or shutdown.
What’s Actually Modeled in LED CFD Thermal Simulation
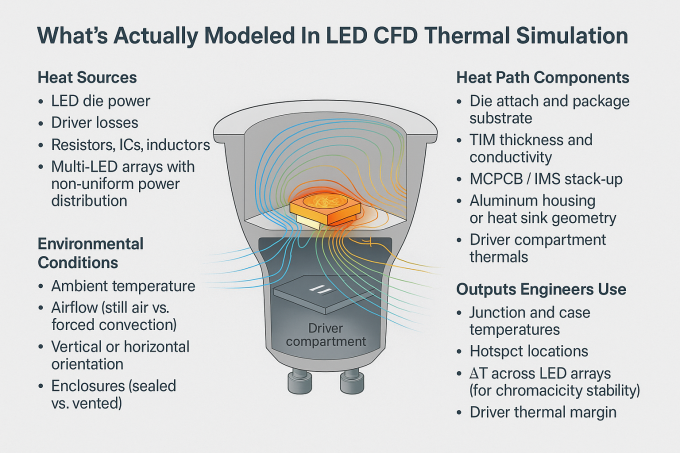
Modern CFD tools simulate conjugate heat transfer—the interaction between heat conduction in solids and convection/radiation in air. For LED systems, this includes:
1. Heat Sources
- LED die power
-
Driver losses
-
Resistors, ICs, inductors
-
Multi-LED arrays with non-uniform power distribution
2. Heat Path Components
- Die attach and package substrate
-
TIM thickness and conductivity
-
MCPCB stack-up (dielectric thickness, copper weight)
-
Aluminum housing or heat sink geometry
-
Driver compartment thermals
3. Environmental Conditions
- Ambient temperature
-
Airflow (still air vs. forced convection)
-
Vertical or horizontal orientation
-
Enclosures (sealed vs. vented)
4. Outputs Engineers Use
- Junction and case temperatures
-
Hotspot locations
-
ΔT across LED arrays (for chromaticity stability)
-
Driver thermal margin
-
Temperature drop at each interface
-
Heat-sink efficiency and airflow pattern
A Practical Simulation-Driven Design Workflow
A disciplined workflow reduces risk and accelerates development. High-performing LED teams follow this cycle:
Step 1 — Define Requirements
Translate photometric and reliability targets into thermal limits:
Step 2 — Build a Minimal Viable Thermal Model
Include only geometry that affects heat flow meaningfully:
- LED package blocks
-
MCPCB layers
-
TIM
-
Heat-sink fins
-
Enclosure and vents
This keeps solve times reasonable and encourages rapid iteration.
Step 3 — Validate With a Quick Physical Test
Use a simple test fixture and thermocouples or IR imaging to calibrate:
- Contact resistances
-
Material emissivity
-
TIM performance
Once correlation is within 3–5°C, the model becomes trustworthy across variants.
Step 4 — Run a Design of Experiments (DoE)
Vary:
- Copper thickness
-
Via arrays
-
TIM conductivity
-
Fin spacing
-
Vent area
-
Housing thickness
Run simulations in batches, then fit a response surface to see which parameters matter most.
Step 5 — Confirm Robustness
Simulate worst-case scenarios:
Document margins before handing over to tooling.
How Thermal Simulation Benefits Distributors and ODM Customers
Distributors and ODM clients face customer complaints, returns, and the risk of failed installations. Simulation gives them confidence in the product.
Key Benefits
1. Faster Technical Approval
Clear derating curves and installation limits allow engineers to approve new SKUs faster.
2. Lower RMA Rates
Thermal hotspots often cause early failures.
Better designs mean fewer replacements and lower warranty cost.
3. Easier System Integration
ODM teams can plug validated thermal models into their housings without recreating the analysis.
4. Transparent Product Performance
Providing temperature maps and limits increases trust and differentiates you from “generic” manufacturers.
Deliverables That Strengthen B2B Partnerships
Top-tier LED suppliers deliver more than just a datasheet. Include:
1. Executive Thermal Summary (Non-technical)
2. Full Technical Thermal Report
3. Installation Guide
4. Derating Curves
For example:
5. CAD and Simulation Packages
Help partners integrate your LED module into their own enclosures.
Common Thermal Mistakes and How Simulation Prevents Them
| Mistake |
Consequence |
How Simulation Helps |
| Over-reliance on MCPCB |
Hot drivers, uneven color |
Visualizes hotspots across the entire assembly |
| “Oversized heat sink” mentality |
Wasted material cost |
Right-sizes the heat sink based on real loads |
| Ignoring convection limits |
Case temps exceed spec in sealed fixtures |
Simulates sealed vs. vented performance |
| No bin variation modeling |
Color drift |
Includes worst-case LED bins in thermal model |
| Driver placed near LED array |
Derating and shutdown |
Identifies thermal coupling early |
30-Day Adoption Plan for LED Manufacturers
A simple rollout plan for teams new to simulation:
Week 1 — Build the Foundation
Week 2 — Correlate the Model
Week 3 — Optimize Using DoE
Week 4 — Package Deliverables
Conclusion — Make Thermal Simulation Part of Your Standard LED Development
Thermal simulation transforms LED development from trial-and-error into a predictable, data-driven process. Manufacturers gain faster development cycles, confident design decisions, lower BOM cost, and reduced field failures.
By validating a minimal model once, reusing templates across product families, and sharing results with distributors and ODM clients, you elevate both engineering quality and commercial impact.
When thermal margins stop being unknowns, product reliability becomes repeatable—and that’s where true LED competitiveness begins.


 Your message must be between 20-3,000 characters!